Scientific Graphics
It can be beneficial to make your research ideas and proposal plans understandable to non-experts. As you are not guaranteed reading committee members from your field, you will benefit from graphics that make your plans clear and understandable.
I create these graphics using various types of software and iterate with you until we agree that I have created a figure that is true to your science, while maximizing understanding. (Examples below)
This is quicker for astronomical topics, but I have also created figures for geology, chemistry, and biology projects and I'm always happy to try something new!
PRELIFE
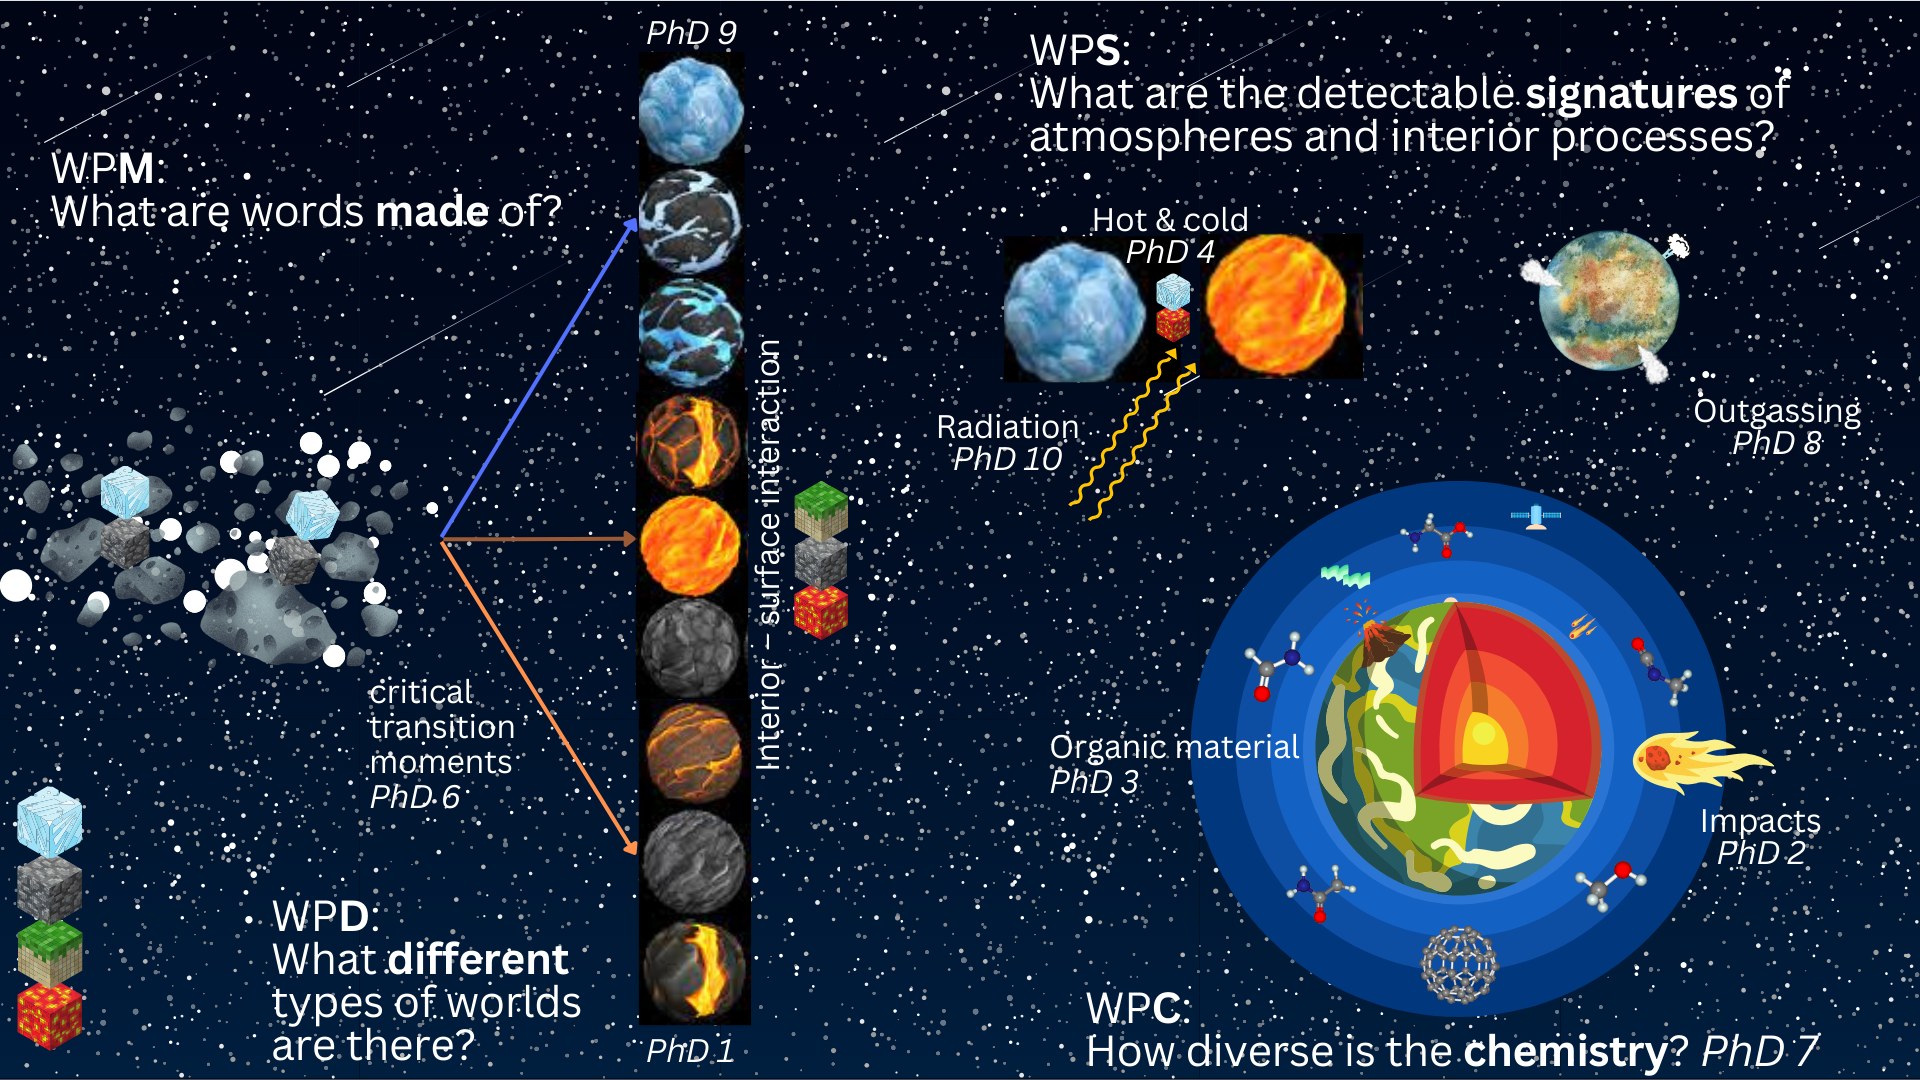
I was tasked with creating visual representations for all of the work packages in the large interdisciplinary project PRELIFE. The PRELIFE (Pathways, Reactions, and Environments leading to LIFE: An interdisciplinary approach) project was recently awarded funding from NWO (Dutch Science Council) to run a massive interconnected research project including 16 PhD students and more than 100 consortium members. News links: origin center, UvA, RUG, HvA (Dutch), VU,
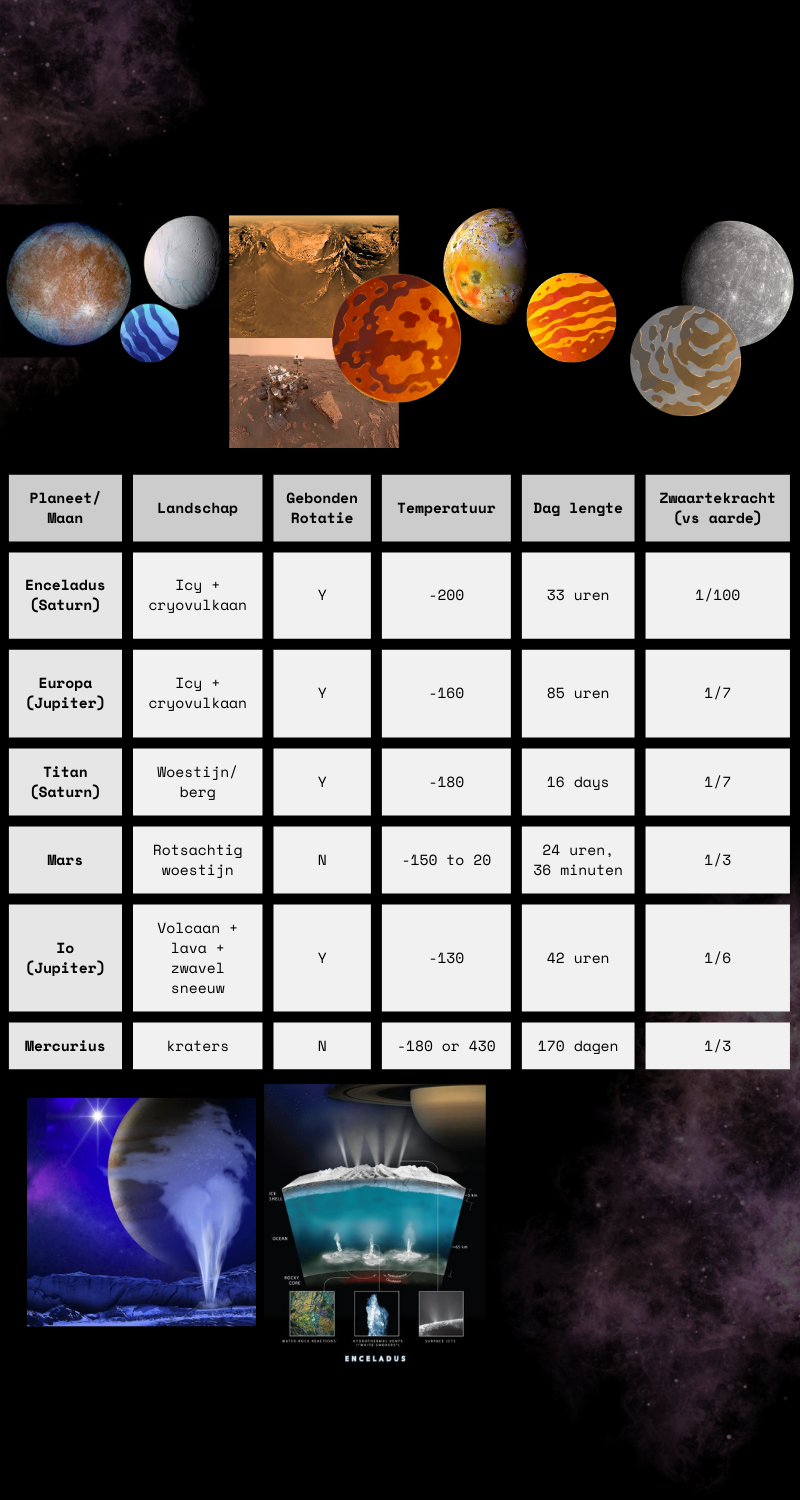
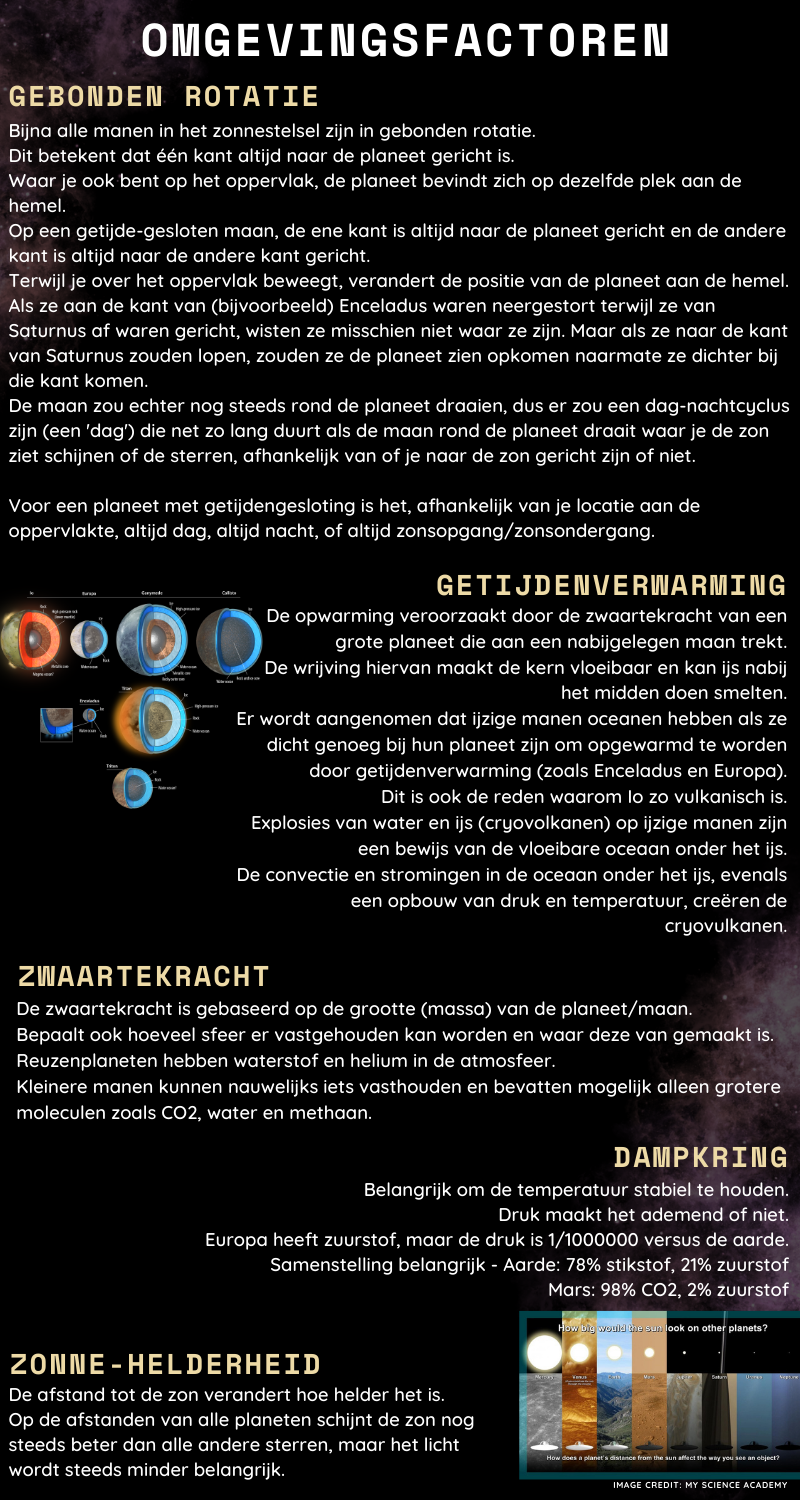
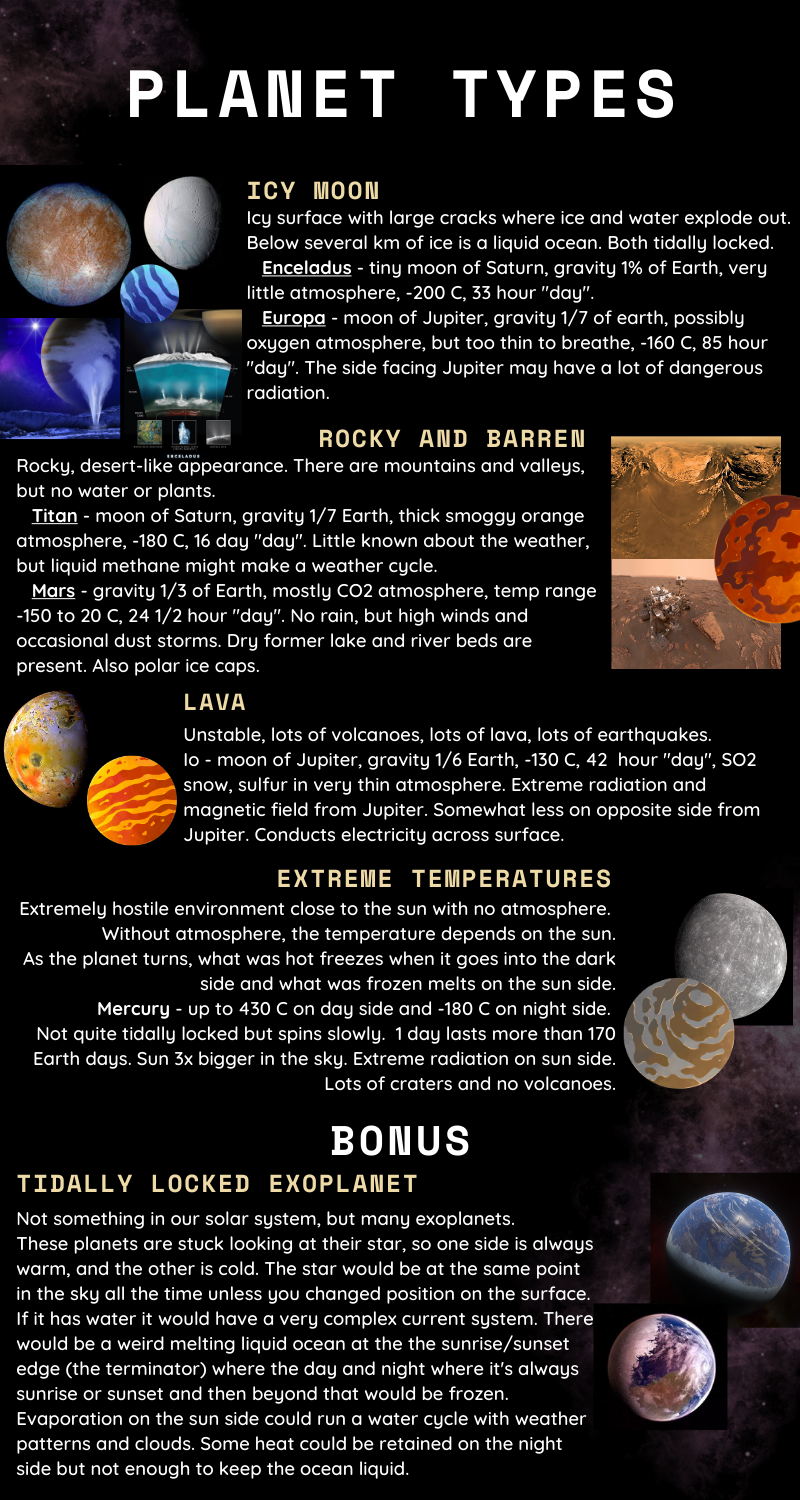
Other infographic work